Chapter – 2
Demographic structure of Indian society
In this post we have given the detailed notes of class 12 Sociology Chapter 2 (Demographic structure of Indian society) in English. These notes are useful for the students who are going to appear in class 12 board exams.

| Board | CBSE Board, UP Board, JAC Board, Bihar Board, HBSE Board, UBSE Board, PSEB Board, RBSE Board |
| Textbook | NCERT |
| Class | Class 12 |
| Subject | Sociology |
| Chapter no. | Chapter 2 |
| Chapter Name | (Demographic structure of Indian society) |
| Category | Class 12 Sociology Notes in English |
| Medium | English |
- Chapter – 2
- Demographic structure of Indian society
- More Important Links
Demography
- The systematic study of population is called population.
- In English it is called demography, it is made up of two words Demos i.e. people and graphene i.e. description.
- This is how demography means. Description of people
- In other words, describing the population of a country on the basis of its characteristics such as age, gender, occupation, etc. is called demography.

Types of Demographics
- There are mainly two types of demography: –
Morphological Demographics
- Under morphological demography, the characteristics of a population are measured based on numbers.
- For example: –
- Number of women
- Number of males
- The number of people working in a particular field
- Number of poor in the country etc.
- For example: –
Social Demographics
- Under social demography, population is measured on the basis of other characteristics.
- For example: –
- Social characteristics
- Economic characteristics
- Political features etc.
- For example: –
Crude birth rate
- The crude birth rate is related to live children given birth by thousands of women.
- Suppose 20 children are given birth by Hazare women in the area during a time interval. So the crude birth rate of that area would be 20.
Yarn: –
![]()
Crude mortality rate
- The number of deaths per thousand people in an area during a year is called crude mortality rate.
Yarn:-
![]()
Migration
- The phenomenon of people moving from one place to another is called migration.
- Types of Migration
- ever
- Temporary
- seasonal
Sex ratio
- The ratio between the number of females and males in a population is called the sex ratio.
- Formula for measuring sex ratio in the world.
Yarn: –

- Formula for measuring sex ratio in India.
Yarn: –
![]()
Age Structure
- The age structure shows the number of people in different age groups.
- It helps us to know the number of people present in the country within different age groups.
- It is mainly divided into three sections.
0 to 15
- It is a dependent population, it includes children.
- Because children under this age are in the development phase and are busy getting education, they are called dependents, because they are not working.
- When the population is high in this category, the cost of education facilities in the country increases.
15 to 59
- This class represents the working population.
- Almost all the people present in this class are employed and cooperate in the development of the country.
Above 60 years
- When the population is high in this category, the pace of development in the country increases.
- It mainly consists of an elderly population.
- In the event of such a large population, the cost of health-related services, pension, etc. increases in the country.
- This is also called dependent population.
Literacy
- A literate person is a person who can understand, read and write simple sentences in his everyday life.
- The literacy rate shows the social and economic status of the country.
- Higher literacy rate means higher social and economic status, whereas lower literacy rate indicates lower social and economic status.
- It also gives knowledge of the policies and facilities of the government.
- In India, a person above the age of 7 years is considered literate who can read, write and do arithmetic calculations.
Infant mortality rate
- The number of children who die within 1 year out of every 1000 children born alive is called infant mortality rate.
Maternal mortality rate
- This is the number of women who die while giving birth to their children in 1000 cases of live delivery.
Fertility rate
- The fertility rate is the number of live births per thousand women of childbearing age (15 to 49 years).
Population growth
- The population change that takes place during a particular time in an area is called population growth.
- If the population of that area increases during that time, it is called positive population growth. If the population of the area decreases during that time, it is called negative population growth.
Positive population growth
- If the population increases in an area during a time, it is called positive population growth.
Negative population growth
- If the population decreases in an area during a time, it is called negative population growth.
Population growth rate
- When the change of population is expressed in percentage, it is called population growth rate.
Natural growth of population
- The population that increases due to the difference between death and birth during a time inside an area is called the natural growth of the population of the area.
![]()
Real growth of population
- It includes the growth of natural population as well as migration.
![]()
Rural and Urban Infrastructure
- Rural urban organization represents the population living in villages and cities within a country.
- It is evaluated based on place of residence.
- The village mainly has low population density, and people are engaged in agricultural work.
- On the contrary, the population density is higher inside the cities.
- And people are mainly employed in production and services.
- On the basis of rural and urban structure, we can evaluate the level of development of a country and the facilities available there.
Dependency Ratio
- It is the ratio of the dependent and working share of the population.
- A dependent population is the part of the population that is either old or young.
- The older population is not able to work due to old age and on the other hand, the younger population cannot work due to age, hence they are considered as dependent population.
- 0 to 15 Small children (dependents)
- 15 to 64 Working population
- More than 64 Older population (dependent)
Professional Structure
There are mainly 4 sectors in an economy.
Primary Sector
- agriculture
- fishing
- Animal Husbandry etc.
Second Region
- production
- Mining etc.
Third Region
- Services
Fourth Region
- research
- Conceptual development
- Information Technology etc.
According to the area in which most of the working population in the country is employed, we can estimate the economic condition of the area.
- The population employed in the primary sector shows the low level of development in the country.
- The population working in the second sector shows increasing production capacity.
- The population employed in the third sector reflects the level of services in the country.
- The population working within the fourth sector reflects the development and growth of ideas in the country.
Censu
- The process of collecting data related to population and its characteristics in a country is called census.
- In ancient times, the method of collecting population data was called the old or ancient method of census.
- In modern times, the method of census has changed, it was started by America in 1790.
Census in India
- The first census in India was conducted by the British government between 1867-1872.
- After this, the census was conducted in India every 10 years.
- The first census in independent India was conducted in 1951 and since then the census is conducted every 10 years.
Population growth theory
- This theory was introduced by Thomas Robert Malls.
- He described this in his essay ‘Essays on Population’ (1788).
- This is a pessimistic theory.
- According to this, the population of human beings always grows at a faster pace than its means of sustenance. Because of which man always lives in a state of poverty.
- In other words, the human population always grows rapidly, while the resources needed for its sustenance such as food, clothing and other products do not grow as fast as humans always face a shortage of resources.
Solution
According to him, to avoid this situation, it is necessary for humans to control the population.
- That’s how he
- Getting married at an older age.
- By exercising sexual restraint
- By following celibacy
- It can do this by having limited children.
- At the same time, he said that nature also makes efforts to control the population at its own level.
- This is done by nature through natural disasters such as floods, earthquakes, epidemics, etc.
Criticism of Malls’ theory
- Some ideas opposed this, who believed that the availability of resources could be exceeded by the population.
- The theory of malls proved wrong in the future when the availability of resources began to exceed the population.
- Liberal and Marxist thinkers also criticized Malles’ theory.
- He said that the cause of poverty is not increasing population but unequal distribution of resources.
- On the one hand, where some people are using excessive resources, on the other hand, a large population must live in poverty, this is the main cause of poverty.
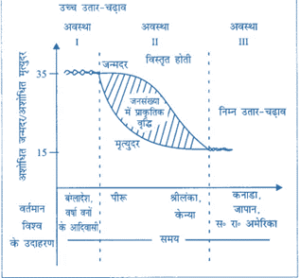
Demographic transition
- The theory of demographic transition helps to describe the population of an area at the present time and predict its status in the future.
Stages
It has three stages: –
- First stage
- At this stage, both the birth rate and the death rate of an area are that.
- Because of which the population growth rate is slow.
- Most people work in farming.
- Life expectancy is low.
- Most people are illiterate, and the rate of growth is low.
- Second stage
- There is a high fertility rate at the beginning of this stage.
- The fertility rate keeps declining over time.
- Mortality is lower due to improvements in health conditions.
- The population growth rate remains positive.
- Third stage
- Both birth rate and death rate are low in this stage.
- The growth rate of the population either stabilizes or remains slow.
- The population is educated, and cities have developed.
- Due to more education and technical knowledge, a person develops the family thoughtfully.
- The population is controlled.
Population Policy of India
- India announced its first population policy in 1952.
- At that time, it was called the National Family Planning Program.
- In the initial phase, its main goal was to bring the birth rate under control by making people aware.
- The period of national emergency completely changed the national family planning program.
- During this period, people were forcibly sterilised as well as other stringent methods of population control were adopted.
- Everyone opposed it and the government that came after the Emergency abolished this system completely.
- After the Emergency, it was changed to the National Family Welfare Program.
- Coercive methods were abandoned, and social awareness and natural methods were adopted.
We hope that class 12 Sociology Book 1 Chapter 2 (Demographic structure of Indian society) notes in English helped you. If you have any query about class 12 Sociology Book 1 Chapter 2 (Demographic structure of Indian society) notes in Hindi or about any other notes of class 12 Sociology in English, so you can comment below. We will reach you as soon as possible…